森林生态系统中的碳循环和水循环是两个紧密耦合的生态过程。目前,全球气候变化加剧了干旱发生的频率和强度,严重影响碳水耦合过程,也大大增加了碳循环和水循环预测的不确定性。因此,为有效管理森林生态系统和应对全球气候变化,需要准确地探索森林生态系统碳水耦合关系。
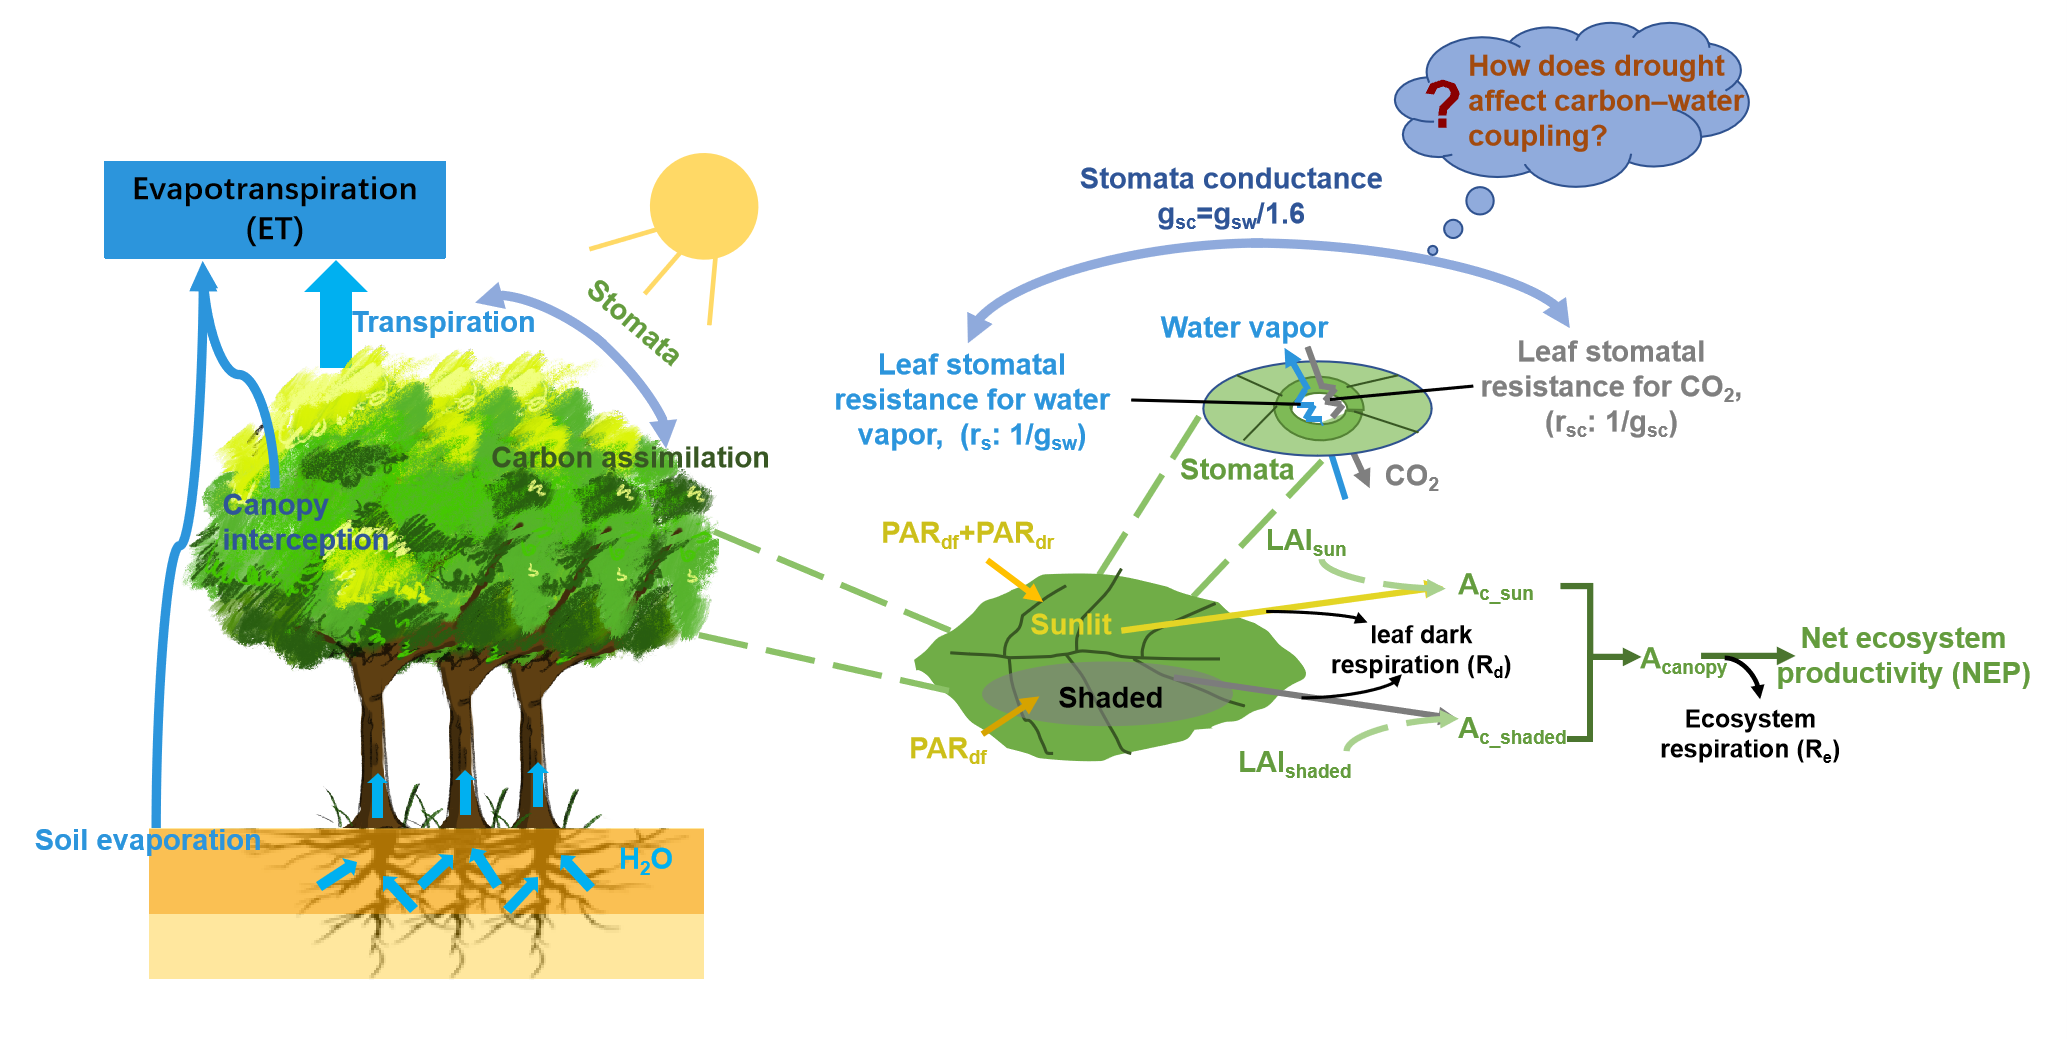
本研究基于碳水耦合原理,以气孔导度为连接,整合TRIPLEX-Flux模型和Penman-Monteith方程,并在气孔导度子模块中引入了土壤水分(SWC)和饱和水气压差(VPD)建立了TRIPLEX-CW-Flux碳水耦合模型(Figure 1),以准确估算森林生态系统碳水通量。此外,本研究开发了新的R程序包(rTRIPLEXCWFlux),TRIPLEX-CW-Flux模型的计算已编写入R语言(v4.1.3)rTRIPLEXCWFlux程序包中,该程序包的实现提高了模型计算的效率,也便于对模型结果进行进一步的统计分析。

Figure 1 Conceptual diagram of the TRIPLEX-CW-Flux model. Ac_sun, Ac_shaded, and Acanopy are net CO2 assimilation rates for sunlit leaves, shaded leaves, and canopy, respectively; gsw and gsc are stomatal conductance for water vapor and CO2, respectively; LAIsun and LAIshaded are leaf area index for sunlit and shaded canopy, respectively; and PARdf and PARdr are diffusive and direct radiation, respectively.
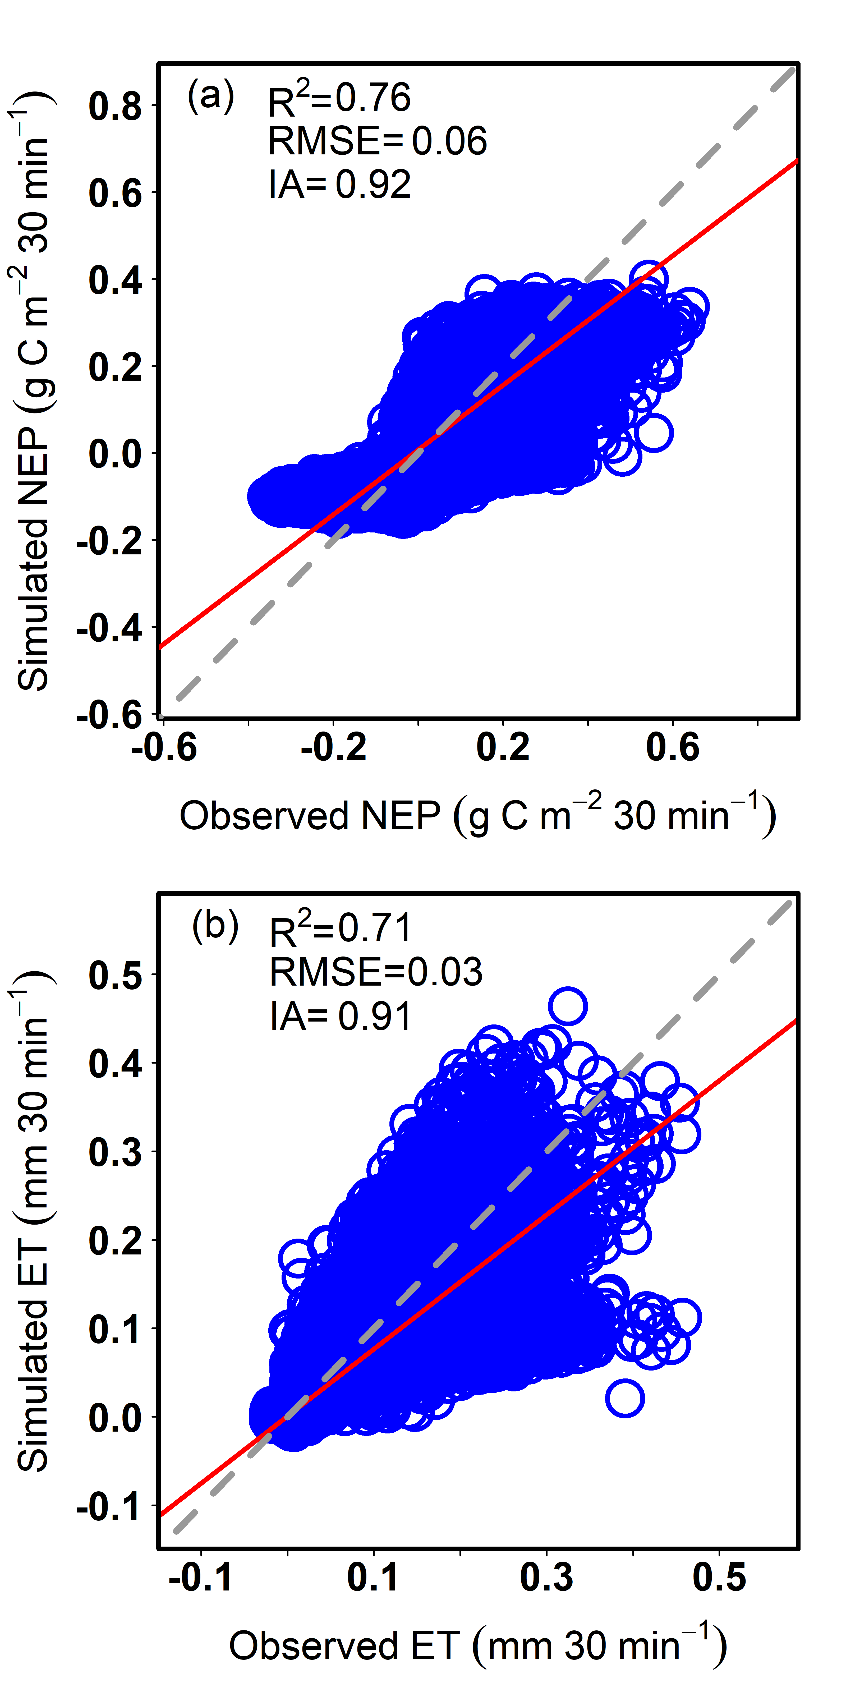
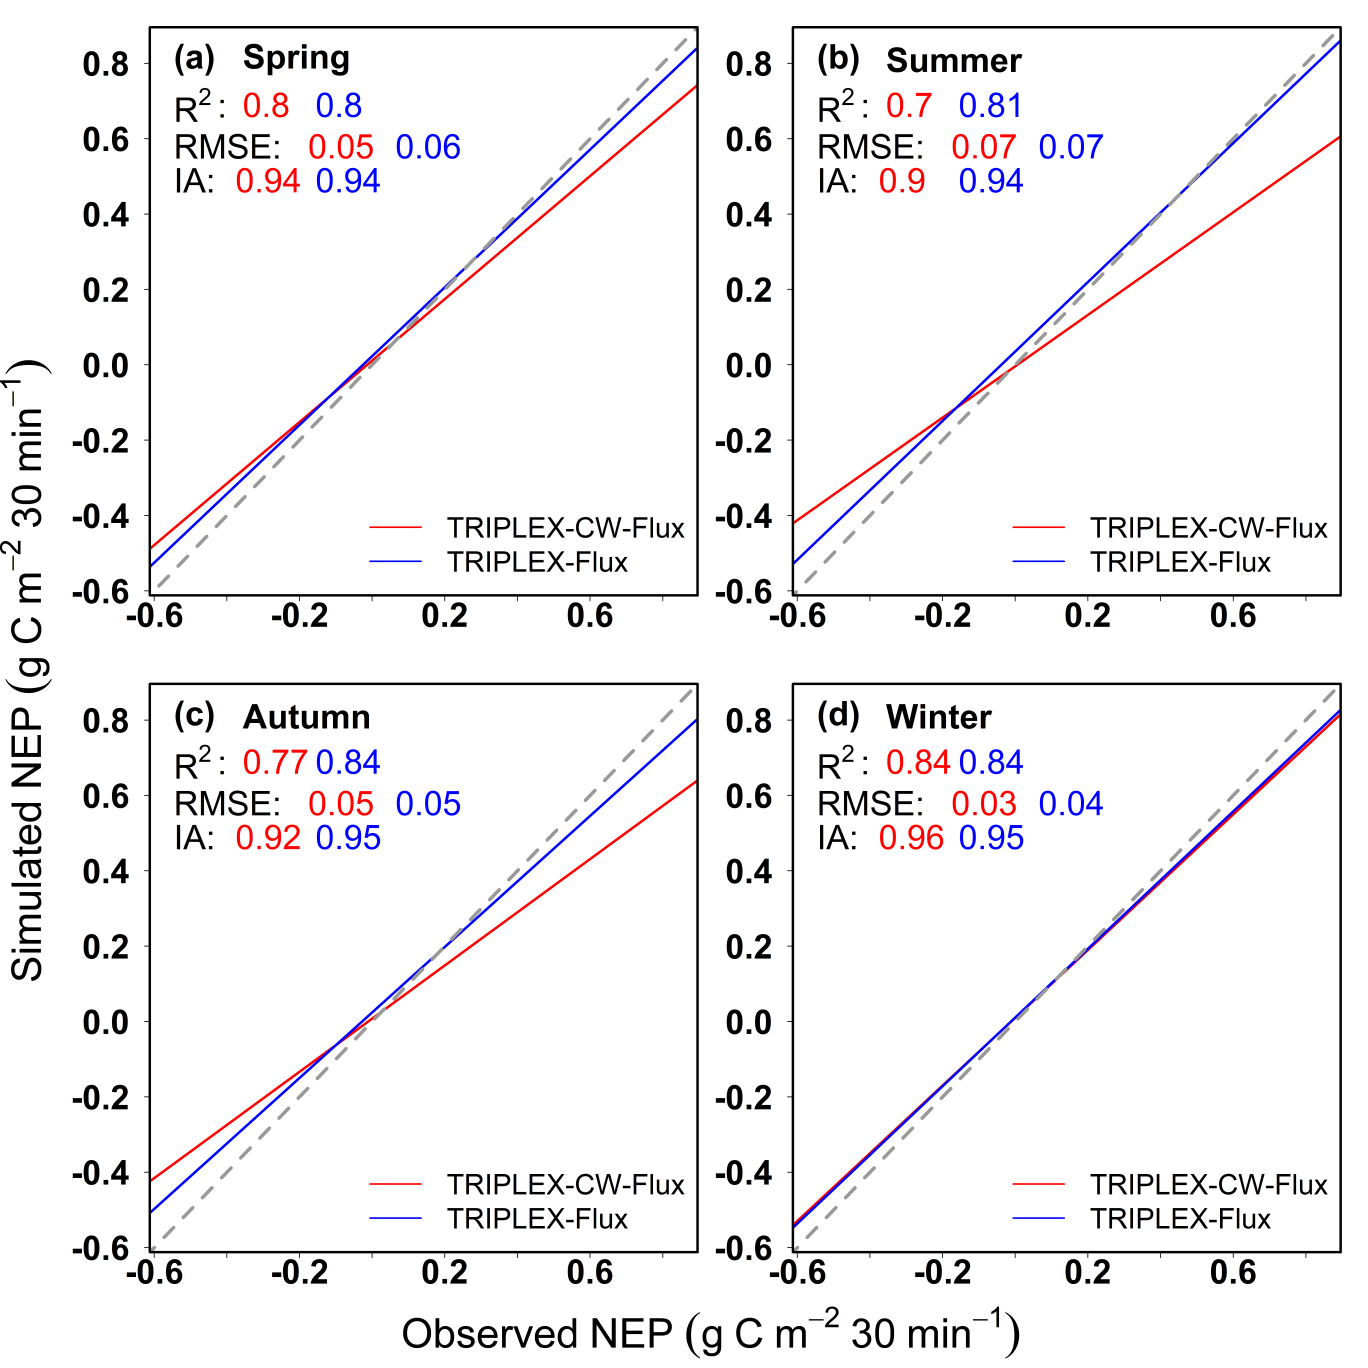
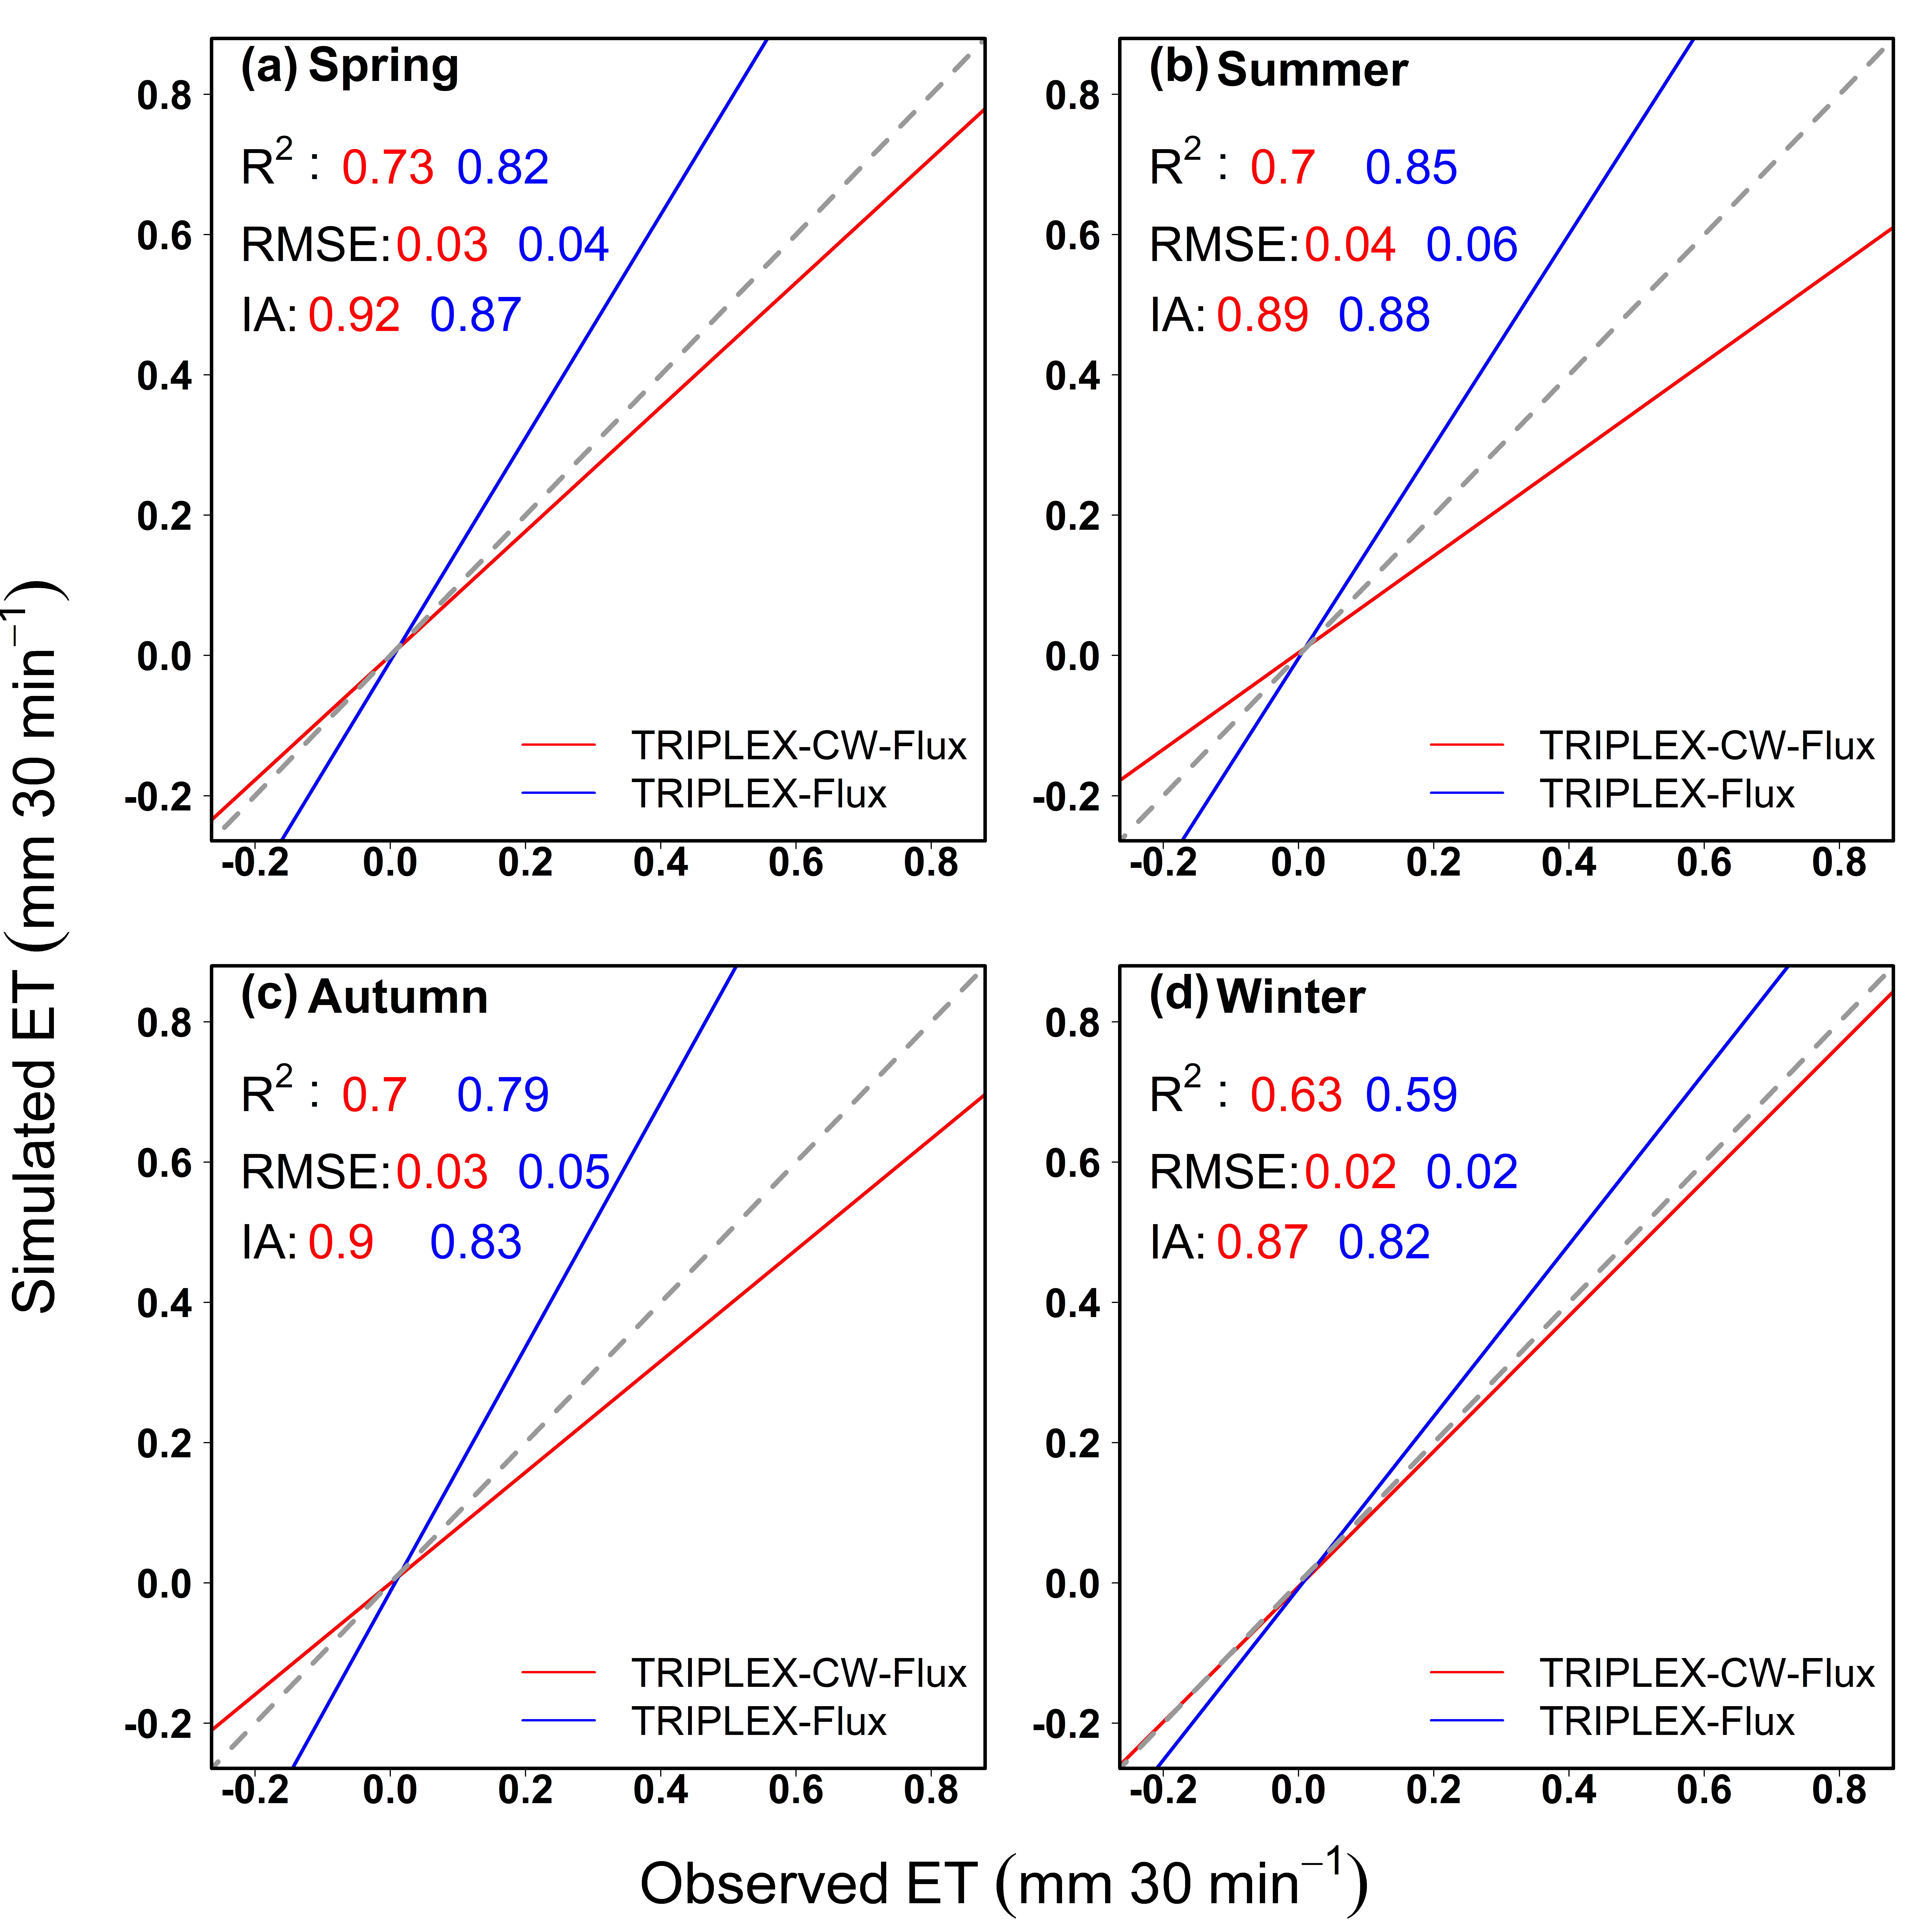
以会同站杉木人工林生态系统为案例研究,结果表明:(1)TRIPLEX-CW-Flux估算的2019-2020年杉木人工林净生态系统生产力(NEP)和蒸散量(ET)与涡度通量塔观测值较为吻合(NEP: R2=0.76, IA=0.92; ET: R2=0.71, IA=0.91)(Figure 2);(2)利用杉木人工林的通量观测数据,比较了TRIPLEX-CW-Flux模型与TRIPLEX-Flux模型的模拟性能。两种模型模拟的四个季节NEP与通量塔观测结果吻合较好(Figure 3),但TRIPLEX-CW-Flux模型估算ET的精度较TRIPLEX-Flux模型更高(Figure 4)。这表明,引入了SWC和VPD后优化的气孔导度子模块可以提高模型对森林生态系统水通量的预测精度。同时也强调了干旱胁迫在碳水耦合估算过程中的重要性;(3)rTRIPLEXCWFlux包已成功地在杉木人工林的案例研究中进行了测试,计算全年30分钟尺度的通量数据(17520条)及绘制模拟结果与观测值效果比较图大概共只需要4分钟。该程序包有效地提高了模型计算的速度,并且也可以快速、准确地调整模型所需参数。

Figure 2 Comparison of (a) net ecosystem productivity (NEP) at 30-min time scale and (b) evapotranspiration (ET) values simulated by the TRIPLEX-CW-Flux model with the corresponding observed values by an eddy covariance method in a Chinese fir plantation from 2019 to 2020.

Figure 3 Comparison of simulated net ecosystem productivity (NEP) by TRIPLEX-CW-Flux model (red line) and TRIPLEX-Flux (blue line) at 30 min scale verse observed value by the eddy covariance (EC) method in (a) spring (March, April, and May), (b) summer (June, July, and August), (c) autumn (September, October, and November), and (d) winter (December, January and February) in a Chinese fir plantation from 2019 to 2020.

Figure 4 Comparison of simulated evapotranspiration (ET) by TRIPLEX-CW-Flux model (red line) and TRIPLEX-Flux (blue line) at 30 min scale verse observed value by the eddy covariance (EC) method in (a) spring (March, April, and May), (b) summer (June, July, and August), (c) autumn (September, October, and November), and (d) winter (December, January and February) in a Chinese fir plantation from 2019 to 2020.
上述研究结果以“rTRIPLEXCWFlux: An R package for carbon-water coupling model to simulate net ecosystem productivity and evapotranspiration in forests”为题发表在国际学术期刊Environmental Modelling & Software上。2021级博士研究生孙淑兰为第一作者,项文化教授为通讯作者,合作作者包括加拿大蒙特利尔大学彭长辉教授和湖南师范大学周晓路教授。本研究得到了湖南省重点研发计划项目(2021NK2031)和国家重点研发计划项目(2021YFD22004)等项目的资助。
文章链接:Shulan Sun, Shuai Ouyang, Yanting Hu, Zhonghui Zhao, Meixian Liu, Liang Chen, Yelin Zeng, Changhui Peng, Xiaolu Zhou, & Wenhua Xiang* (2023). rTRIPLEXCWFlux: An R package for carbon-water coupling model to simulate net ecosystem productivity and evapotranspiration in forests. Environmental Modelling & Software, 162(D24): 105661. doi: 10.1016/j.envsoft.2023.105661.
TRIPLEX-CW-Flux模型的rTRIPLEXCWFlux程序包源代码和内置数据在MIT +文件许可下发布。本研究描述的版本(v0.3.0)可以通过GitHub https://github.com/ShulanSun/rTRIPLEX_CW_Flux访问,也可在R语言中运行“devtools::install_github("ShulanSun/rTRIPLEX_CW_Flux")”完成下载。